When week three of Major League Soccer closed the second best team performance in measuring possession with purpose was Colorado Rapids – fast forward to the end of week ten and who should sit second best in team performance? Colorado Rapids!
So if you think their early start was a fluke – think again.
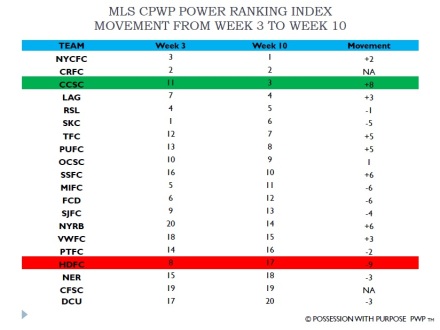
And to clarify – my power rankings are purely objective – no fancy opinions – no feelings – no indirect or direct influence by one person over another – it’s clinical, objective, published in Europe, and measures team performance unlike any other Index in the World.
Bottom line here – there is no subjectivity and how a team finished last year has absolutely no bearing on where that team started and ranks this year.
Some thoughts about team performance after week ten:
- New York City now leads the Power Ranking, and probably for good reason. They’ve earned good points of late and with Patrick Vieira in charge it’s likely their overall balance in, possession-based, purposeful penetration (as we see quite often in England) has begun to take shape here.
- The hum-bummers from week three to week ten are Houston Dynamo – their fall from grace is nine places… now they not only don’t earn points they don’t score goals either. Luckily Owen Coyle doesn’t have to worry about relegation in this country!
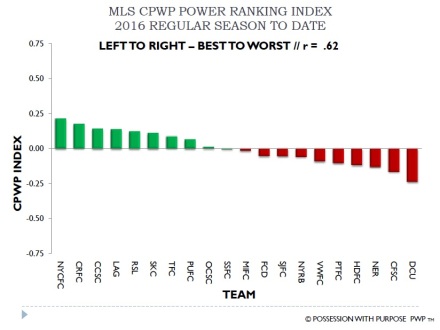
- The big deceiver so far are Columbus Crew – in other words they look good here but look terrible in the league table. This is a great example of two things – one that stats don’t always tell the story and two there are more ways to earn points than one.
- Montreal Impact is the big sleeper here – like F.C. Dallas last year the Impact are earning points with less possession – if you played Advanced Dungeons and Dragons you’d probably offer that the Impact are diametrically opposed to the Crew – I’d say your right.
- Other (Galant) Steady-Eddies, in the early going, appear to be Real Salt Lake and Orlando City.
- The (Goofus) Steady-Eddies appear to be Portland Timbers, New England Revolution, Chicago Fire, and D.C. United.
- For Portland their downside is defending – it’s terrible and the loss of Jorge Villafana remains a gap unfilled! You say Chris Klute has stepped in – I say he hasn’t – the reason why is simple – Diego Chara continues to get pulled wide and it leaves a huge defensive gap atop the 18 yard box. The longer the opponents succeed in having Diego Chara spend large amounts of time defending low risk attacking areas the better. And who teaches those guys to defend set-pieces? WOW!
- In regards to United and the Fire – who knows what gives there – perhaps the only thing that wakes up the owner of Chicago is another MLS team starting up in Chicago! As for United – Ben Olsen pretty much punted the entire 2013 season and it looks like that will be the case this year. If you’re going to bet on a U.S. Open Cup winner this year – go with D.C. United.
The CPWP Index – two views on team performance…
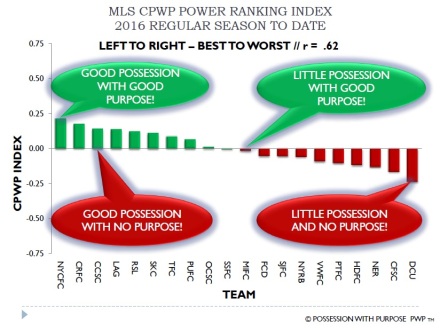
Over the remainder of the year I’m going to offer up four teams who fit these team performance categories the best:
- Good possession with good purpose – New York City
- Little possession with good purpose – Montreal Impact
- Good possession with no purpose – Columbus Crew
- Little possession with no purpose – DC United
And to follow that, some additional insight for your consideration (the way to really see why you can’t simply look at attacking or defending statistics separately – you must look at them together) on attacking team performance.
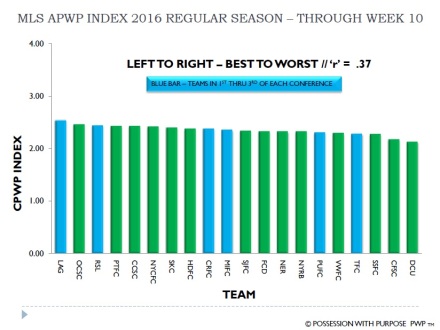
The diagram above shows Attacking PWP only – this is strictly the statistical roll up of each teams attacking team performance. Note the four blue bars – these are the top three teams in each conference. Now my observations relative to what the Index shows:
- L.A. Galaxy – their are top of the Attacking PWP Index – meaning – from a points earned standpoint the best way to best understand their overall success is to track how well they score goals.
- Real Salt Lake – like the Galaxy a great way to understand their success is to understand their attacking statistics.
- Colorado and Montreal are slightly further down the Index – what does this mean? It means their attacking statistics add value but that’s not what their overall success is directly related to when it comes to points earned.
- Philadelphia Union and Toronto F.C. are on the lower end of the Index – meaning their attacking isn’t really the main driver on why they have been successful in earning points – it’s more about something else. What is that?
Here’s the Defending PWP Index – same approach applies here – this is a statistical roll up of each teams’ defending team performance ((i.e. how well the opponents’ combined attacking PWP data goes against their defenders); again the top three teams in each conference are shown with blue bars:
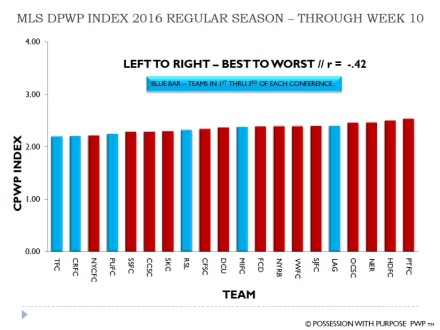
- Toronto FC are best in the defending performance index – with Colorado right on their heels. What does this mean? It means the defending unit for those two teams is a considerable factor in those teams taking points – one could argue – given Philadelphia’s position in fourth the same can be said for them. Put another way – if these three teams continue to play strong defense they should continue to take points.
- Real Salt Lake is a tad bit further down the line and of all the teams this year they appear the most balanced when it comes to taking points – in other words their effective in playing with or without the ball.
- The same could almost be said for Montreal – with one exception – they don’t like to play with the ball so their defending statistics are not going to show well.
- As for the Galaxy – they are near bottom of this Index – pretty much confirming that if/when they earn points they do so because they score more goals than their opponents.
In Closing:
- Note the “r’ for DPWP is -.42 and for APWP it is .37 – and then see that the ‘r’ for CPWP is .61.
- What this means is that, on their own, neither the Attacking nor Defending PWP team performance statistics have as strong a relationship to points earned in the league table than the Consolidated PWP Index. Further statistical validation that individual and team attacking statistics cannot and will not properly account for the true value of a player on the pitch.
- This statistical relationship has occurred every year in every league I’ve measured across Major League Soccer, Europe, as well as the Men’s and Women’s World Cup!
- So if you see pundits or sports writers/analysts making a big deal about one players’ individual attacking statistics it’s bollocks; it takes viewing both sides of the pitch to know the true value of a player and how they impact the team.
- Finally, if you want to know more about Possession with Purpose read this latest article on Moneyball 2 – Soccer Statistics.
Best, Chris
Copyright, All Rights Reserved. PWP – Trademark


